- Home
- Ecosystem
- ARK Score
ARK Score
The ARK Score
An AI model reads every asset the way a careful investor would: how consistent its revenue is, what could move it next and what multiple it should trade at. One score sums it up.
A music catalog
- Consistency
- 92
- Demand
- 78
- Track record
- 88
- Catalysts
- +0.6×
Example figures. A guide, not a guarantee.

Every asset streams data
Payouts, sales, holders, the creator’s record and the market around the asset feed the ARK Score model as they happen.
How steady is the revenue?
The model reads every payout: how regular it is, how much it swings and how fast it grows. Steady revenue scores higher than spiky revenue.
What could move it next
Market catalysts are weighed: streaming growth, a tour, demand in the category, press, interest rates. Each one pushes the outlook up or down.
What it should trade at
Comparable assets set a base revenue multiple. Consistency and catalysts adjust it into a fair multiple for this asset.
One score. One fair price.
The result is an ARK Score and a fair price in revenue multiples, shown next to the listing price. A guide, not a guarantee.
Example figures for illustration. The ARK Score is a guide, not a guarantee or advice to buy.
Inputs
What the model looks at
- 01The creator
Past launches, sales and how consistently the creator delivers.
- 02Demand
How many people buy and hold the asset, and how fast it sells.
- 03The market
Comparable assets, how the category is moving and the catalysts around it.
- 04Payout history
For revenue assets: whether payouts arrive on time and in full.
Outputs
One number to compare listings quickly.
What the asset should trade at, as a revenue multiple.
Where the price could go, based on trends in its category.
Example
Two music assets, side by side
Same category, very different records. Read the score with the terms and documents, then decide.
Three years of on-time payouts and steady demand.
A first release with no payout history yet. Its score can rise as it builds a record.
Illustrative scores.
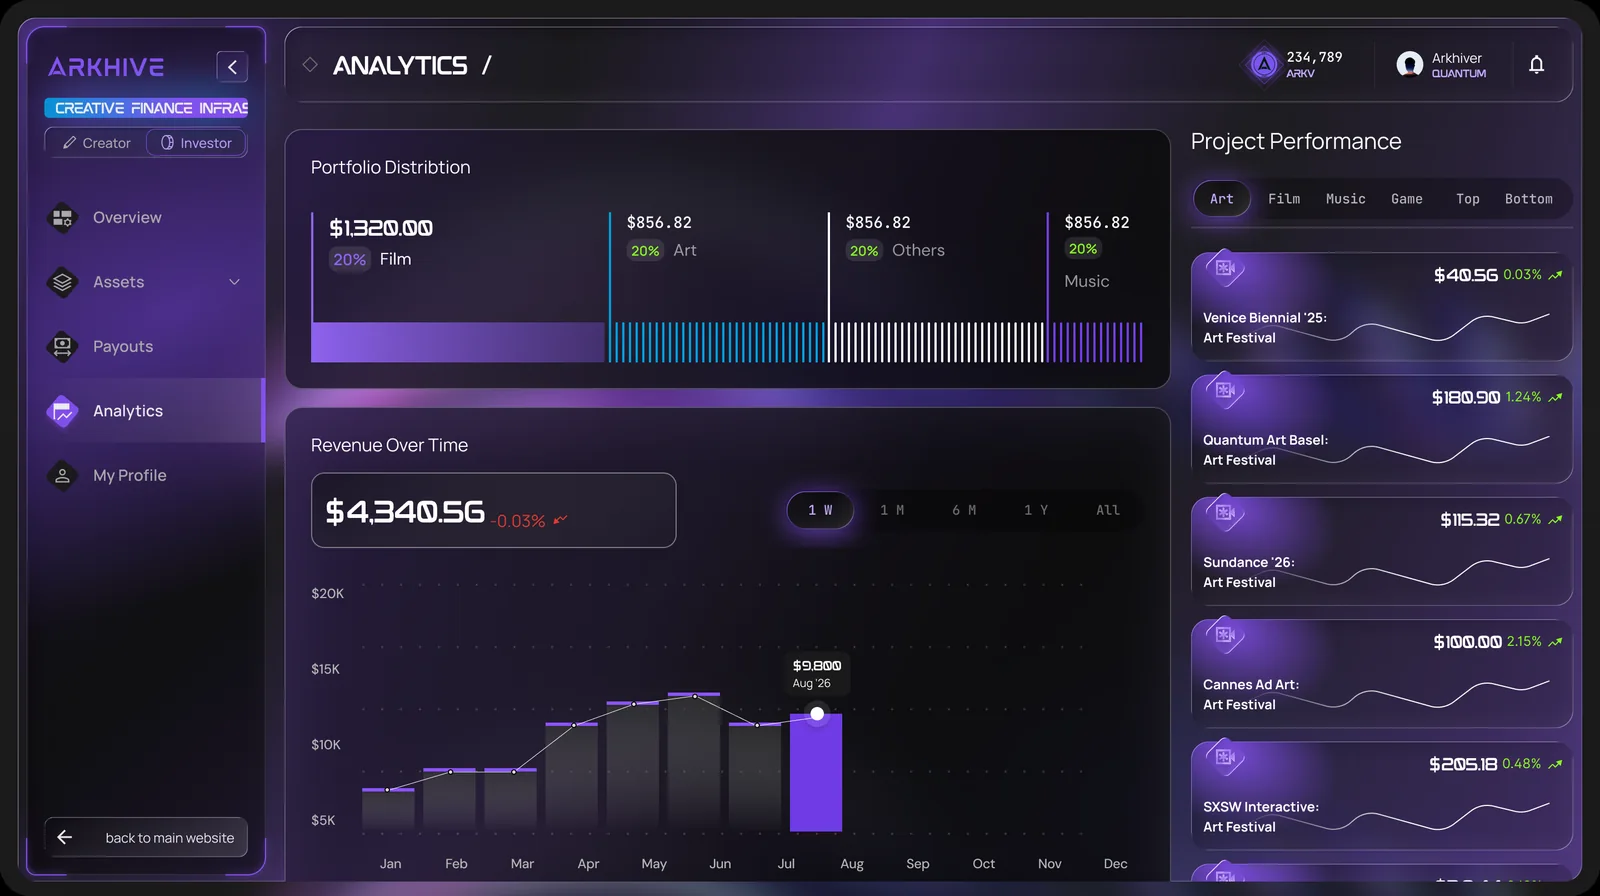
Screen from the ARKHIVE dApp. Figures shown are sample data.
Who it helps
Useful on both sides of a sale
- Creators
- Set a fair launch price from real demand and comparable assets.
- Buyers
- Spot good value and check an asset’s record before buying.
- Revenue assets
- See whether payouts have been regular, at a glance.
Questions
About the ARK Score
Is a high score a guarantee?
No. The score sums up history and current data. Prices and payouts can still change.
Who calculates it?
ARKHIVE’s AI model, trained on real market behavior and updated as new data comes in.
Where do I see it?
On every listing and offering page in the dApp, next to the terms.
Can a score change?
Yes. It updates as new sales, payouts and market data come in.

Compare with confidence
See the ARK Score on every listing in the ARKHIVE marketplace.